Measuring Soil Water
Soil water measurement falls into two broad categories:
Volumetric Measurement
Measures the percentage of water by volume in a given amount of soil. Gives an absolute water content figure, but the meaning of that number varies significantly by soil type.
Tensiometric Measurement
Measures the physical force holding water in the soil, expressed in Centibars (or kPa) of soil water tension. This is the method used by IRROMETER instruments and WATERMARK sensors.
The amount of water in the soil is less important than how difficult it is for the plant to extract it. Soil water tension — or matric potential — is what must be overcome for a plant to move water into its root system. Different soil types will have different tensions at the same volumetric water content, making volumetric data relative to local conditions and often requiring site-specific calibration.
Because IRROMETER sensors measure tension directly, no site calibration is required. And because tensiometers have been used in research since the 1920s and commercially available since 1951, decades of university and extension research have produced a well-established body of reference data for recommended tension levels across common crops and landscapes.
Sensor Options
We offer two methods for reading soil water tension, each suited to different conditions and applications:
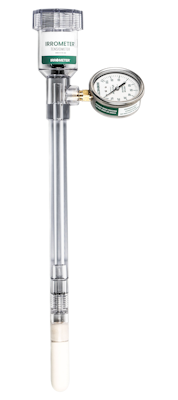
IRROMETER Tensiometer
The tensiometer is the only direct measurement instrument available — measuring the physical forces at work in the soil rather than indirectly measuring an electrical property. It acts like an artificial root, interacting with soil through a ceramic tip. As soil dries, it draws water from inside the instrument through the tip, creating a measurable tension read by a mechanical gauge or transducer.
This is the most direct and accurate method available. Periodic maintenance is required to replenish water, and instruments should be removed during winter months to avoid freezing damage.

WATERMARK Sensor
The WATERMARK is a "Granular Matrix Sensor" that electronically reads moisture absorbed through a precisely composed granular matrix. This material buffers the sensor against salinity effects and provides a much longer service life than traditional gypsum blocks. WATERMARK readings are calibrated to the same values measured by a tensiometer.
Maintenance-free with an expected life of 5+ years, WATERMARK sensors can be left in the ground permanently. They require minimal power and are well-suited for data loggers and IoT devices.
Selecting the Right Sensor
The following table presents the general characteristics and suitability for each sensor type based on soil conditions and crop sensitivity:
| Sensor | Soil Type | Crop Sensitivity | Tension Range |
|---|---|---|---|
| IRROMETER SR | Lighter to medium | Sensitive to medium sensitivity | 15 to 75 cb |
| IRROMETER LT | Non-soil media, amended soils, coarse or sandy | Very sensitive | 5 to 20 cb |
| WATERMARK 200SS | Medium to heavy | Medium to tolerant | 30 to 200 cb |
Selection can also be made by referencing the traditional soil texture triangle:
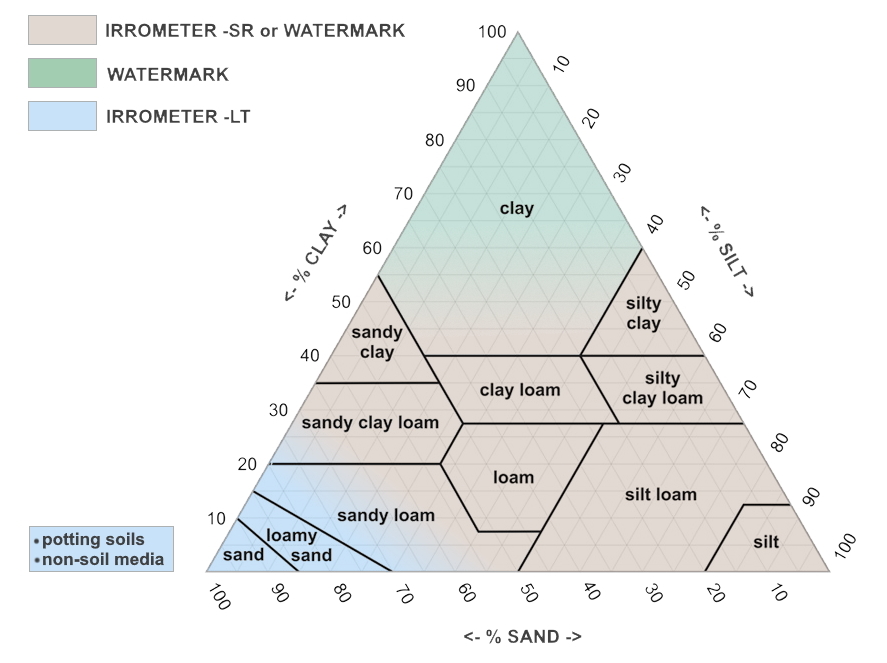
Sensor selection by soil texture — IRROMETER SR and LT for lighter soils, WATERMARK for medium to heavy.
Understanding the Data
When using IRROMETER instruments or WATERMARK sensors, use these readings as general guidelines:
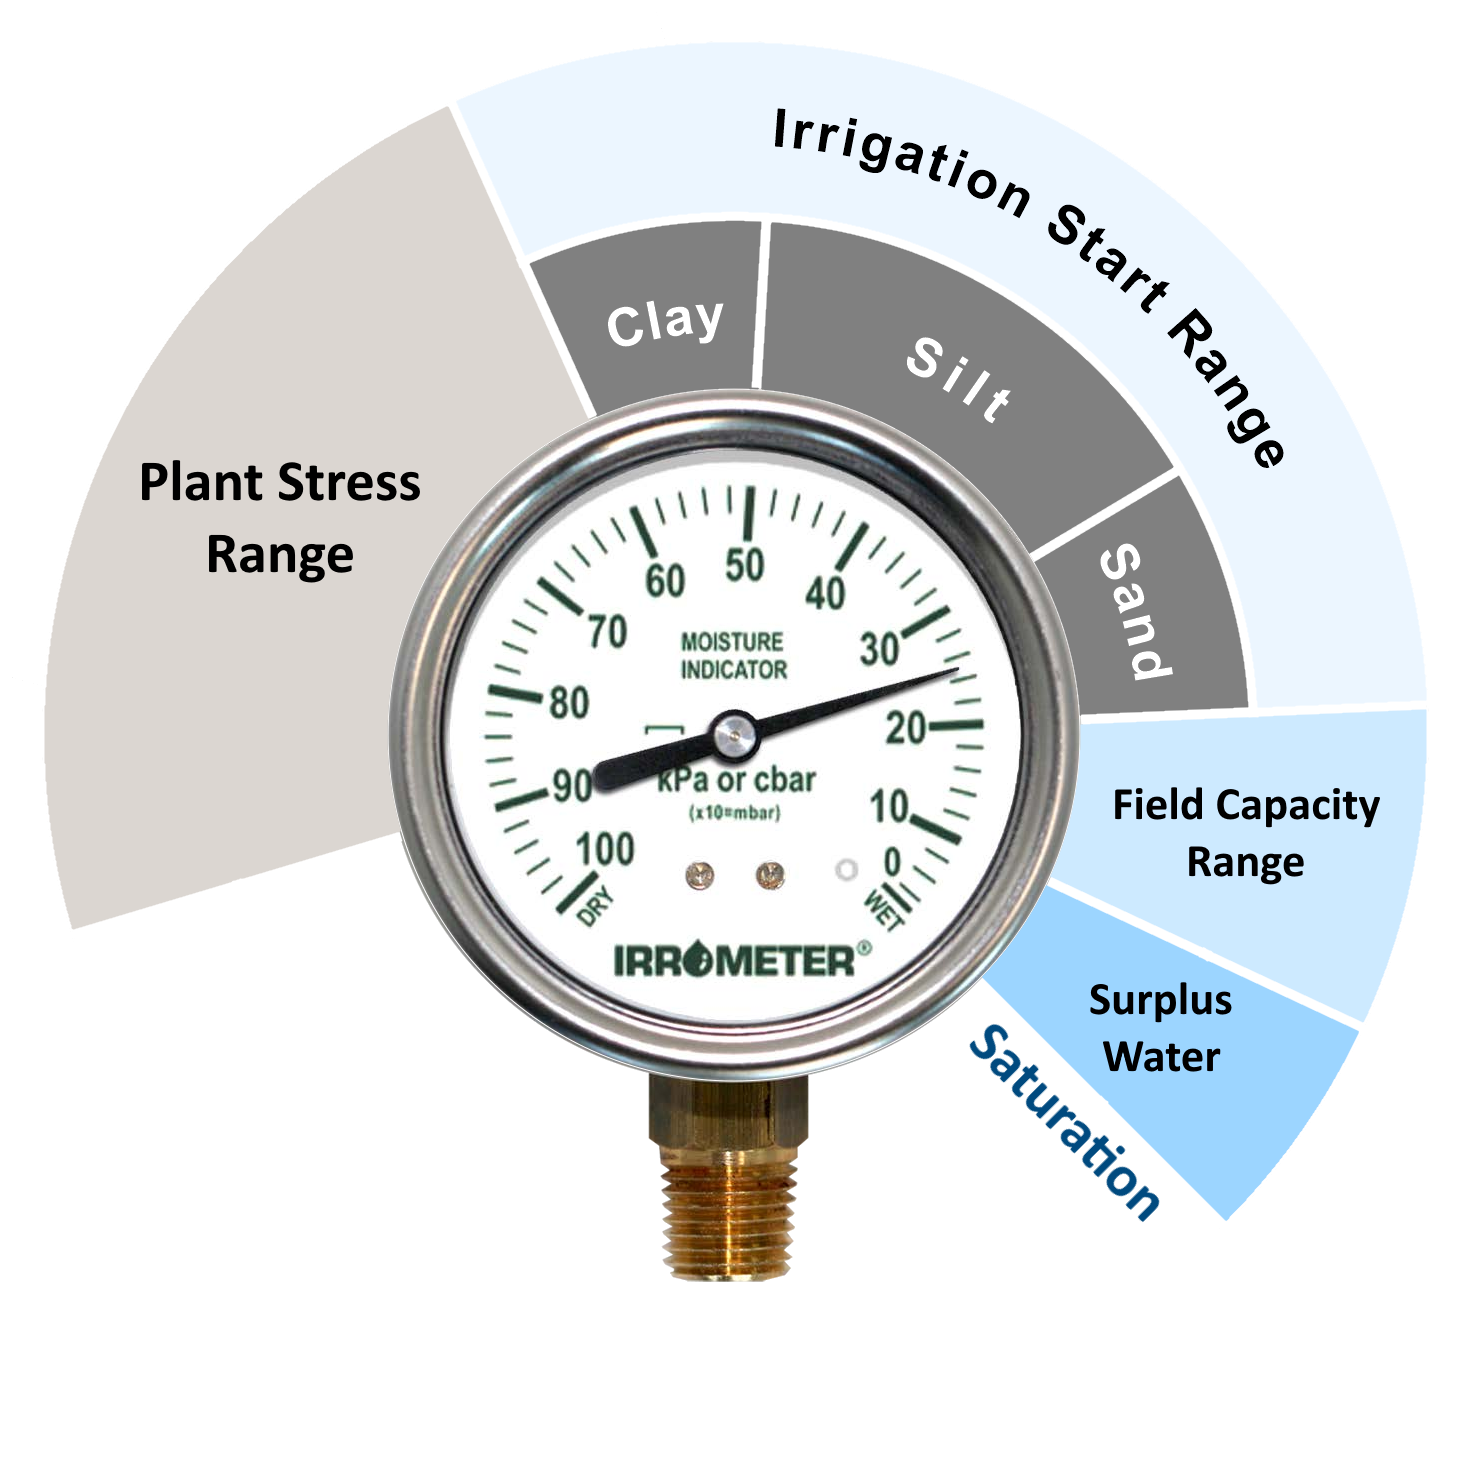
Gauge face interpretation guide — suggested management ranges by crop type
Taking time to interpret your data more deeply will yield more specific irrigation thresholds. A few key concepts:
Field Capacity
The amount of soil water held after excess has drained and the rate of downward movement has decreased.
Permanent Wilting Point
The minimum water in the soil that the plant requires to avoid wilting. Normally defined as 1,500 cb/kPa.
Available Water
Water stored in the soil profile available for plant use — the range between field capacity and wilting point.
Allowable Depletion
The percentage of available water that can be depleted before irrigation is needed to prevent crop stress.
Installing and Preparing Sensors
If sensors aren't in the wetted area where roots are extracting water, the data will have limited value. Proper placement is critical.
Representative Sites
Select locations typical of a larger block — consistent soil type, slope, and sun exposure.
Root Zone Placement
Place in the active root zone and irrigated area. For deep-rooted crops (>18"), use two sensors: shallow at 25% of root depth, deep at 75%.
System-Specific Placement
Trees: at canopy drip line. Row crops: in the row. Drip/micro-sprinkler: 12–18" from emitter. Flood/furrow: two-thirds down the run.
WATERMARK Sensor
Sensors can be installed bare or with ½" Class 315 PVC / ¾" CPVC pipe attached to protect wires. Either method gives equivalent results. If using pipe, cement sparingly with PVC-to-ABS transition cement, drill a small vent hole just above the sensor, and cap the top loosely with a vinyl pipe cap (PN: VTC).
Wet/dry cycling stabilizes the sensor matrix. Submerge each evening for a few minutes, hang vertically to dry overnight — repeat 2–3 times. Always install sensors wet: submerge at least 5 minutes before going in the ground.
Use an IRROMETER Installing Tool or ½" steel pipe (7/8" / 22 mm O.D.) to the desired depth.
Critical: Make a slurry of local soil and water. Coat the white sensor body, fill the hole bottom, and push the sensor down — grouting it for full soil contact. Backfill with slurry (bare install) or slurry around the pipe (pipe install). Label wires or pipe for identification.
IRROMETER Tensiometer
Remove the tip wrapper and cap. Fill to ¾ of the reservoir with diluted green fluid (1 capful concentrate per gallon of water). Tap the top with your palm until no bubble remains between the reservoir and water tube.
With the cap off, place the tip in clean water for at least 1 hour. To transport after soaking: replace the wrapper, secure with rubber band, and tighten the cap only ¼ turn past first contact with the stopper.
In loose soils, shorter instruments can be pushed directly to depth. For heavier soils, drive a hole with an IRROMETER Installing Tool or ½" steel pipe (7/8" / 22 mm O.D.). Leave at least 1" (25 mm) between the gauge bottom and the ground surface for the membrane vent.
Do not make the hole larger than necessary — firm soil contact is essential. If the hole is oversized, use a mud slurry to grout the instrument in place. The ceramic tip must rest against the bottom of the hole. Do not make the hole deeper than the instrument length.
Determining Management Thresholds
Thresholds are reference points identifying the upper and lower boundaries for managing allowable depletion. A typical starting point is to manage between 10% (wet end) and 40–50% (dry end) of available water depletion, though this varies by soil type, crop, plant development stage, and irrigation method.
Soil types vary in their capacity to hold water, so available water corresponds to a different tension range for each soil type. For example, 50% depletion in pure loam equals 84 centibars, while in a sandy loam it equals 40 centibars. The chart at right displays these relationships and provides a visual guide for selecting appropriate thresholds.
How to read the chart:
Draw a vertical line from 10% available water depletion (the blue/green boundary) down to your soil type's curve, then horizontally to the left axis to get the WET threshold value. For loam, this is approximately 23 cb (blue arrow).
Repeat from 50% depletion (the green/brown boundary) to get the DRY threshold value. For loam, this is approximately 84 cb (brown arrow).
Note: Irrigation methods applying smaller volumes per cycle (center pivots, drip) typically favor the 30–40% range rather than 50%.
A threshold calculator is available based on this chart — select your soil type, enter an allowable depletion level, and input sensor values to determine whether irrigation is recommended.
There is no substitute for experience and agronomic knowledge. Consult a crop consultant, farm adviser, NRCS, or extension agent for site-specific soil moisture management guidance.
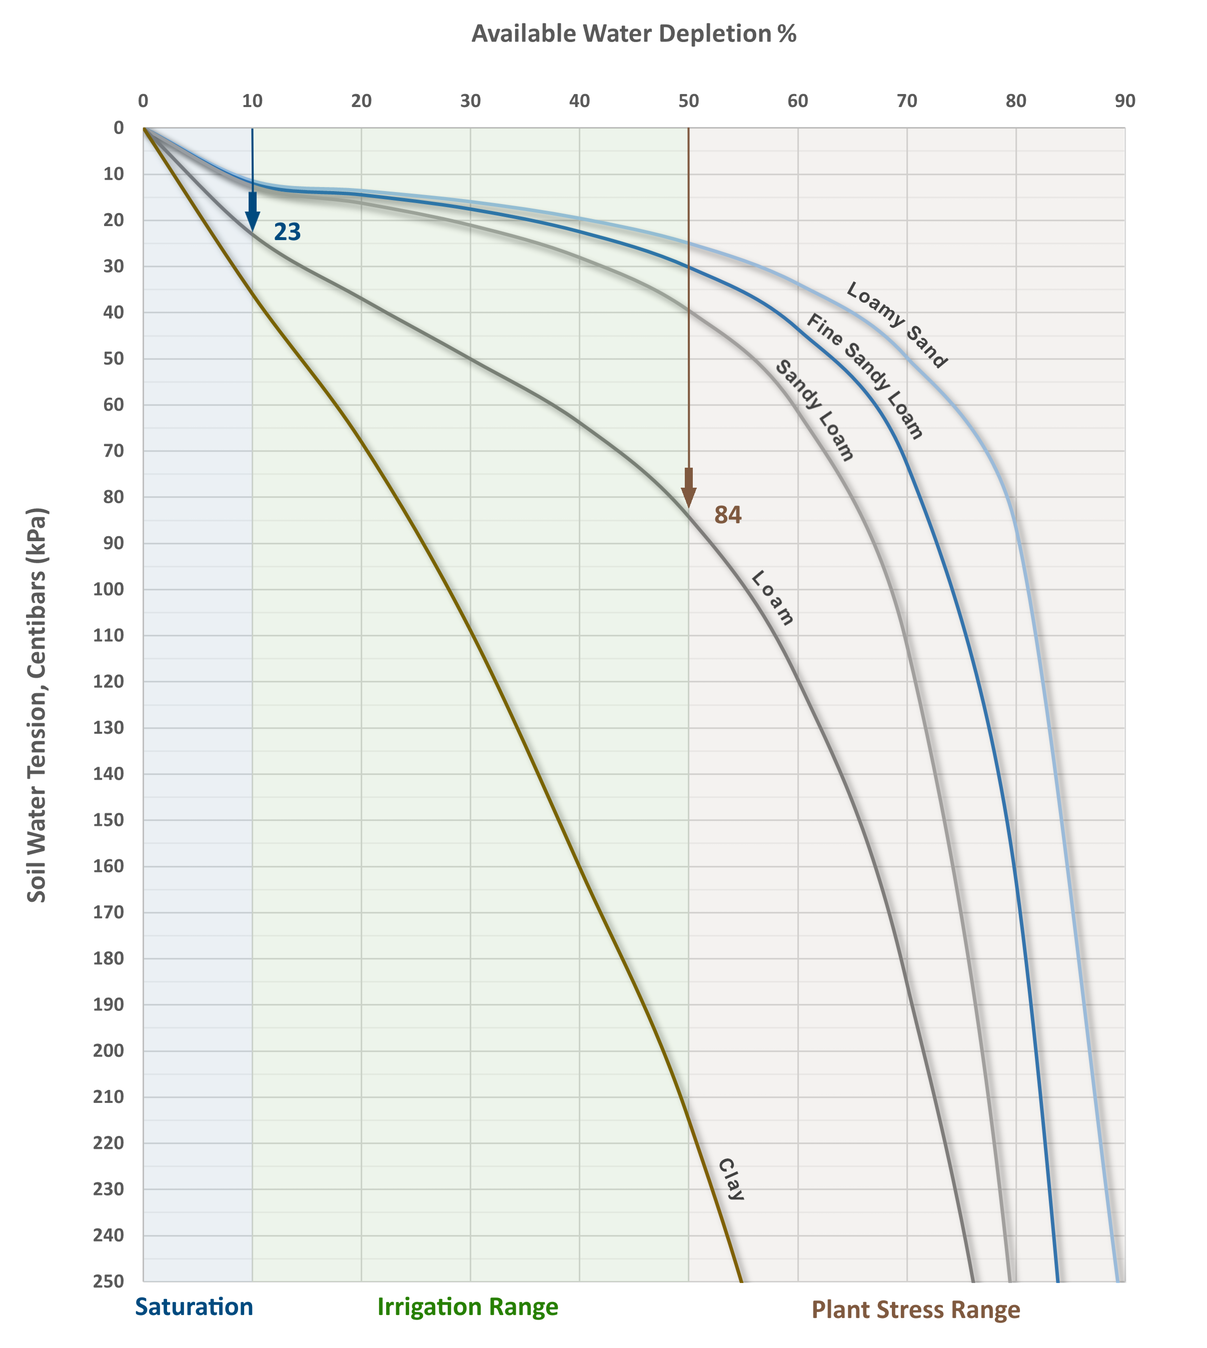
Available water depletion curves by soil texture — tension readings at a given depletion level vary significantly by soil type
Suggested Placement Depths
Based on deep, well-drained soils. In lighter or shallow soils, place instruments accordingly or at an angle. With drip or trickle irrigation, 12" and 24" depths are recommended, with an added 36" instrument for deeply rooted crops.
| Crop | Shallow (in) | Deep (in) | Extra Depth (in) |
|---|---|---|---|
| Alfalfa | 18–24 | 36–48 | 60–70 |
| Almonds | 24 | 48 | 72 |
| Apples | 20 | 40 | 60 |
| Apricots | 24 | 48 | 72 |
| Artichokes | 18 | 36 | — |
| Asparagus | 18–24 | 36–48 | — |
| Avocados | 12 | 24 | 36 |
| Bananas | 12 | 24 | — |
| Barley | 18 | 36 | — |
| Beans (bush) | 10 | — | 18 |
| Beans (Lima) | 18 | 36 | — |
| Beans (Pole) | 18 | 36 | — |
| Beets (sugar) | 18 | 36 | — |
| Beets (table) | 12–18 | 24–36 | — |
| Blueberries | 12 | 24 | — |
| Broccoli | 12 | 20 | — |
| Cabbage | 12 | 20 | — |
| Canaigre | 18 | 36 | 48 |
| Cantaloupe | 18 | 36 | — |
| Carnations | 4–6 | — | — |
| Carrots | 12 | 24 | — |
| Cauliflower | 12 | 24 | — |
| Celery | 10 | 20 | — |
| Chard | 12 | 24 | — |
| Cherries | 24 | 48 | — |
| Christmas Tree | 12 | 24 | — |
| Citrus (Orange, Lemon, Grapefruit) | 18 | 36 | — |
| Coffee | 18–24 | 36–48 | — |
| Corn (sweet) | 12 | 30 | — |
| Corn (field) | 18 | 36 | — |
| Cotton | 18 | 36 | 48 |
| Cranberries | 18 | 36 | — |
| Cucumbers | 18 | 36 | — |
| Date Palm | 24 | 48 | 60 |
| Eggplant | 12 | 24 | — |
| Figs | 18 | 36 | — |
| Garlic | 12 | 24 | — |
| Grain and Flax | 18 | 36 | — |
| Grapes | 24 | 48 | 60 |
| Hops | 24 | 48 | 60 |
| Jojoba | 18 | 36 | — |
| Kiwi | 18 | 36 | 48 |
| Ladino Clover | 10 | 20 | — |
| Lettuce | 12 | — | — |
| Macadamias | 12 | 24 | 36 |
| Maize | 18 | 36 | — |
| Crop | Shallow (in) | Deep (in) | Extra Depth (in) |
|---|---|---|---|
| Melons | 18 | 36 | — |
| Milo | 24 | 48 | — |
| Mint | 12 | 24 | — |
| Monterey Pines, Firs | 12 | 24 | — |
| Mums | 4–6 | — | — |
| Mustard | 18 | 36 | — |
| Nectarines | 18 | 36 | — |
| Oats | 18 | 36 | — |
| Okra | 18 | 36 | — |
| Olives | 24 | 48 | 60 |
| Onions | 12 | — | — |
| Papaya | 12 | 24 | — |
| Parsnips | 18 | 36 | — |
| Peaches | 18 | 36 | 60 |
| Peanuts | 12 | 24 | — |
| Pears | 18 | 36 | 48 |
| Peas | 18 | 36 | — |
| Pecans | 18 | 36 | 48 |
| Peppers | 15 | 30 | — |
| Permanent Pastures | 8–15 | — | 24–30 |
| Persimmons | 18 | 36 | — |
| Pineapple | 15 | 30 | — |
| Pistachio Nuts | 24 | 48 | 60 |
| Plums | 24 | 48 | 72 |
| Pomegranates | 18 | 36 | — |
| Potatoes (Irish) | 8–10 | 18 | — |
| Potatoes (sweet) | 18 | 36 | — |
| Prunes | 24 | 48 | 72 |
| Pumpkin | 18 | 36 | 48 |
| Radishes | 12 | — | — |
| Raspberries | 18 | 36 | — |
| Sorghum | 18 | 36 | — |
| Soy Beans | 18 | 36 | 60 |
| Spinach | 12 | 24 | — |
| Squash (Summer) | 15 | 30 | — |
| Strawberries | 6 | 12 | — |
| Sudan Grass | 18–24 | 36–48 | — |
| Sugar Cane | 18 | 36 | — |
| Sunflowers | 24 | 48 | 60 |
| Tea | 12 | 24 | — |
| Tobacco | 8–15 | 30 | — |
| Tomatoes | 18 | 36 | — |
| Turnips | 18 | 36 | — |
| Walnuts | 24 | 48 | 72 |
| Watermelon | 18 | 36 | 48 |
| Wheat, Hay | 18 | 36 | — |