Reading Tools
Knowing when to irrigate is the difference between a good crop and a great one. Reading your soil water status removes the guesswork.
A single manual reading tells you where you are today. Logged data over time tells you how your soil behaves — how fast it dries down, how deep water penetrates, whether your irrigation is actually reaching the root zone.
That history is what turns reactive irrigation into a managed system. We offer three ways to collect it, from cloud-connected real-time monitoring to handheld spot checks — each suited to a different operation and budget.
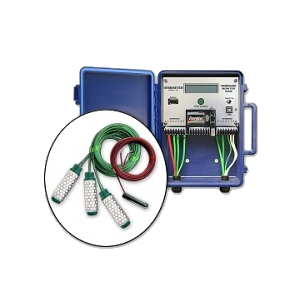
IRROcloud® IC-10
Real-time field data accessible from anywhere. The IC-10 combines cellular connectivity with proven IRROMETER and WATERMARK sensors for reliable, affordable monitoring.
Key Features
- LTE-M cellular - Direct to cloud, no additional hardware needed
- 4+ years battery life
- Install anywhere - No height or solar requirements
- Easy setup - No configuration or calibration required
- Frost alerting via text message
- Supports up to 6 moisture sensors + temp + rainfall + irrigation
- Flow version available for scaled pulse output flow meters

See Your Data, Make Better Decisions
The IRROcloud web app provides comprehensive tools for viewing, analyzing, and managing your field data.

Quick View Dashboard
Device and sensor status, map view, and adjustable threshold gauge panel for at-a-glance monitoring.

Graphing Suite
Detailed analysis of soil moisture, rainfall, irrigation events, temperatures, and device diagnostics.
API Access
Download data via web app or integrate directly with your systems through our open API.
Choose the Right Tool
WATERMARK Monitor (900M)
Stand-alone data logger with USB download and included WaterGraph software. Perfect for growers who want automated data collection without cellular connectivity.
Key Specifications
- • 8 sensor capacity with flexible configuration
- • Selectable reading intervals
- • In-field display for spot checking
- • USB data download to computer
- • WaterGraph software included
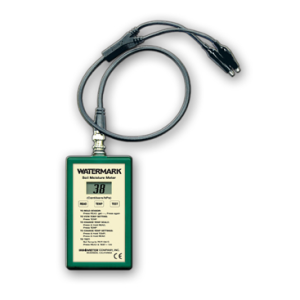
Handheld Watermark Meter
Portable meter for instant WATERMARK sensor readings in the field. Simple, affordable, and requires no installation or setup. Easy alternative to IRROMETER tensiometers.
Key Specifications
- • Instant readings from WATERMARK sensors
- • Digital display in centibars or kPa
- • Portable and battery powered
- • No installation required
- • Affordable entry point for monitoring
Which Solution is Right for You?
Documentation & Support
Ready to Get Started?
Connect with a local dealer to discuss which data collection solution is right for your operation.